Haben Sie Fragen?
+49 9544 68-0
Finally! The cloud solution for leak location and monitoring that can support all your water management tasks.
REPORTING
Create your individual or formal reports - based on your needs. Want to have them shared, daily or monthly with anyone else?
OK, let´s go!
NETWORK MANAGER
Enhance the usage of your POSEYEDON, by synchronize quickly your GIS-databench and let the patterns improve your work!
MISSION CONTROL
A next level Mission Control ticket system, let you coordinate your results, repairs and field staff - based and tracked by created work tickets.
-
FLEXIBLE DASHBOARD
Clear, intuitive and customizable user interface.
-
AVAILABLE EVERYWHERE
All important measurement data and notifications in real time - available directly on your mobile device.
-
LATEST TECHNIQUE
With the IoT technology NarrowBand or LTE (4G), your data is transferred securely, quickly and reliably to the cloud.

Detailed views
- 01
- 02
- 03
- 04
- 05
- 06
- 07
- 08
- 09
- 10
- 11
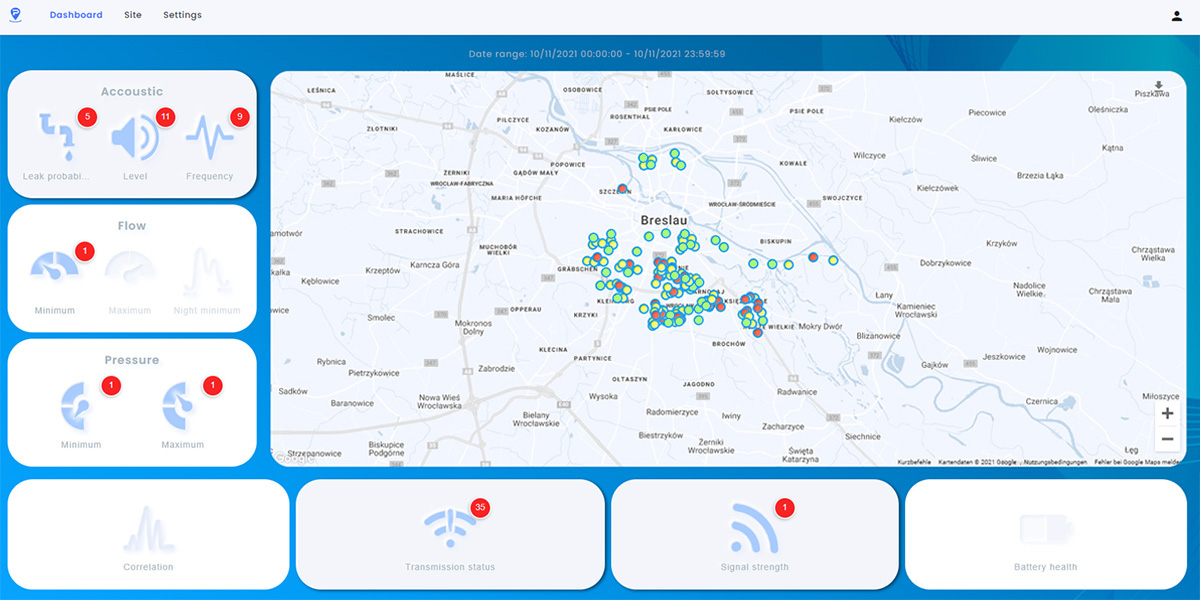
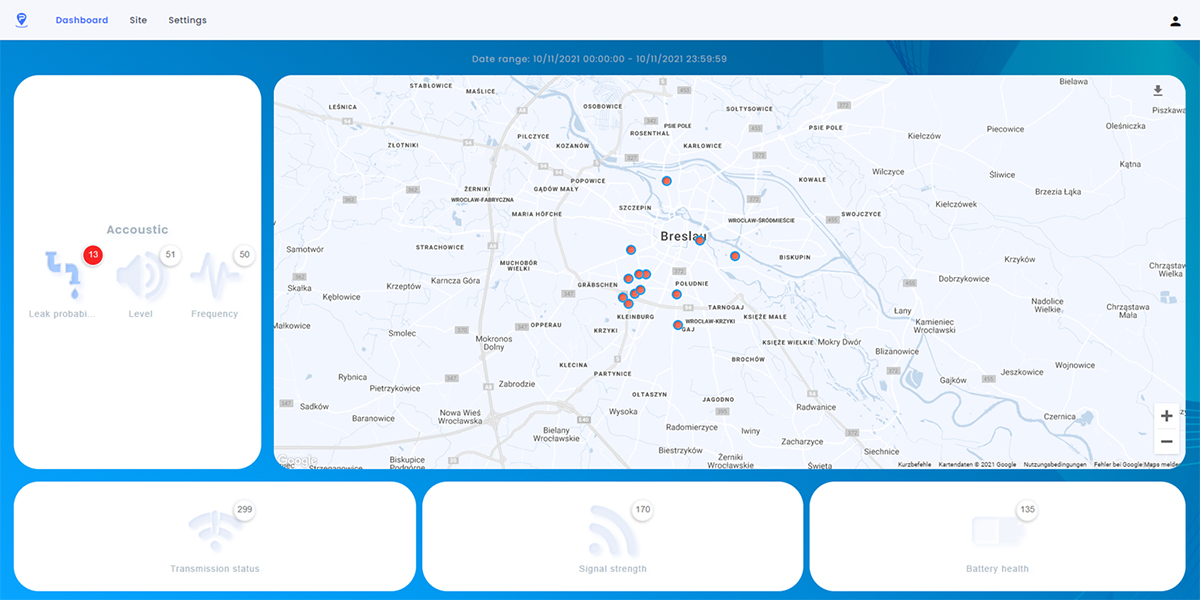
The dashboard adapts to the customer used devices and spots all measurement sites with exceeding thresholds.
In this example we have alarms for:
- Leak probability – sites where level and frequency thresholds are exceeded
- Flow – sites where the set minimum night flow level is not reached
- Pressure – sites where minima or maxima are exceeded
You can also set alarms to identify locations with low batteries, poor signal strengths, or quiet locations.
Only check for the Leak probability Icon – This will only show you sites where the customized level (db) and frequency (hz) thresholds are exeeded.
Take care of the most important leaks first, cross-check the results on site, and quickly fix one leak after another in a targeted manner.
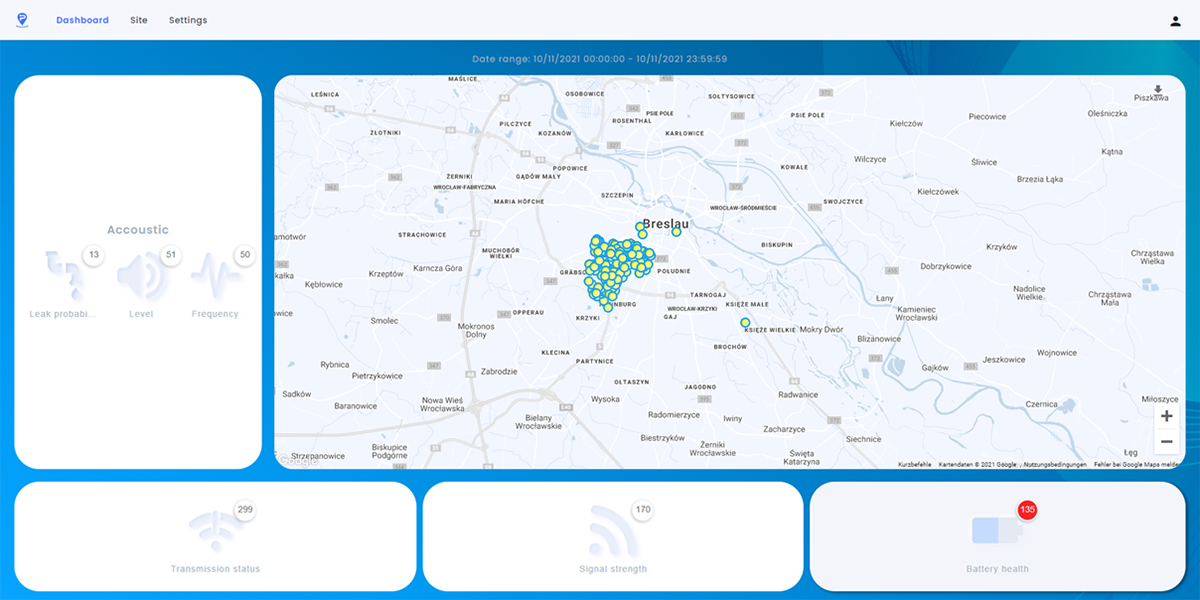
Even the best noise, pressure, data or flow loggers will eventually need fresh batteries.
Don't worry - your dashboard will show you early on which measurement points to consider.
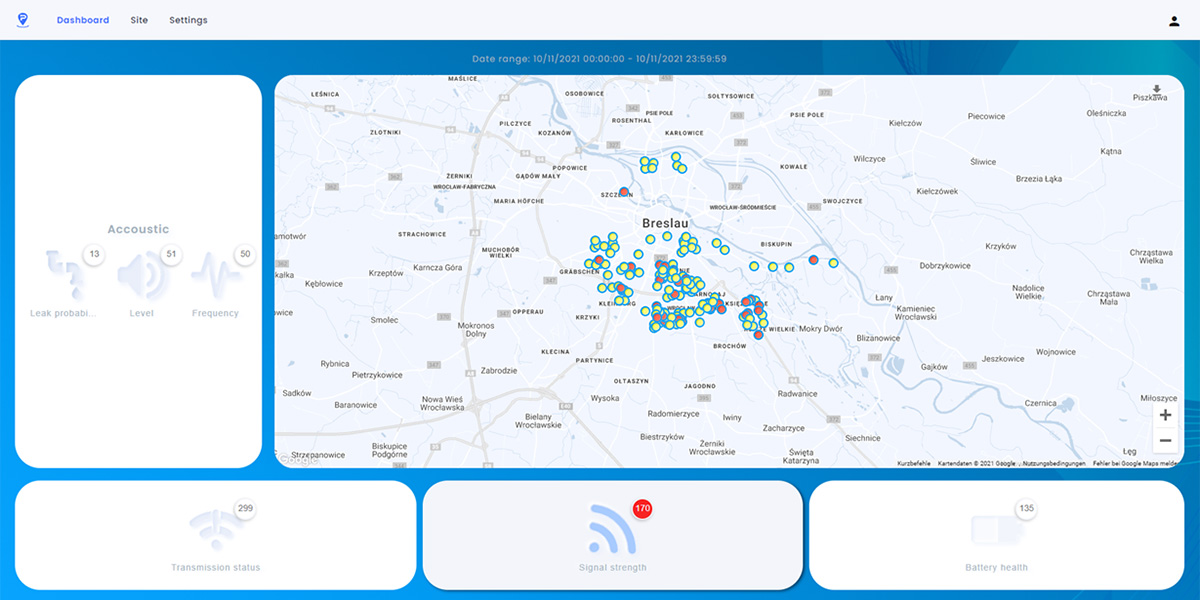
Unfortunately, a strong and extensive radio signal is not always available. Therefore, the system shows you which measuring points you might be able to improve.
Yellow: "the signal could be better, but it is still sufficient"
Red: "oh, the signal is really borderline! Try to move antenna positions, install amplifier antennas or change the lid of the cast maybe"
P.S.: This will improve and ensure a reliable data transmission, and by the way, it saves you a lot of battery power of your logger systems!
The more measuring points are created and the more different measured values are generated and transmitted, the more important good organisation is.
It may seem like a triviality, but it enormously facilitates cooperation between teams. Assign or change measuring point designations easily and quickly. With one click on the default name, you can give it a name! Why don't you just use the address? This is changeable on the left in the sidebar or also within the detail view of a measuring point in the blue header.
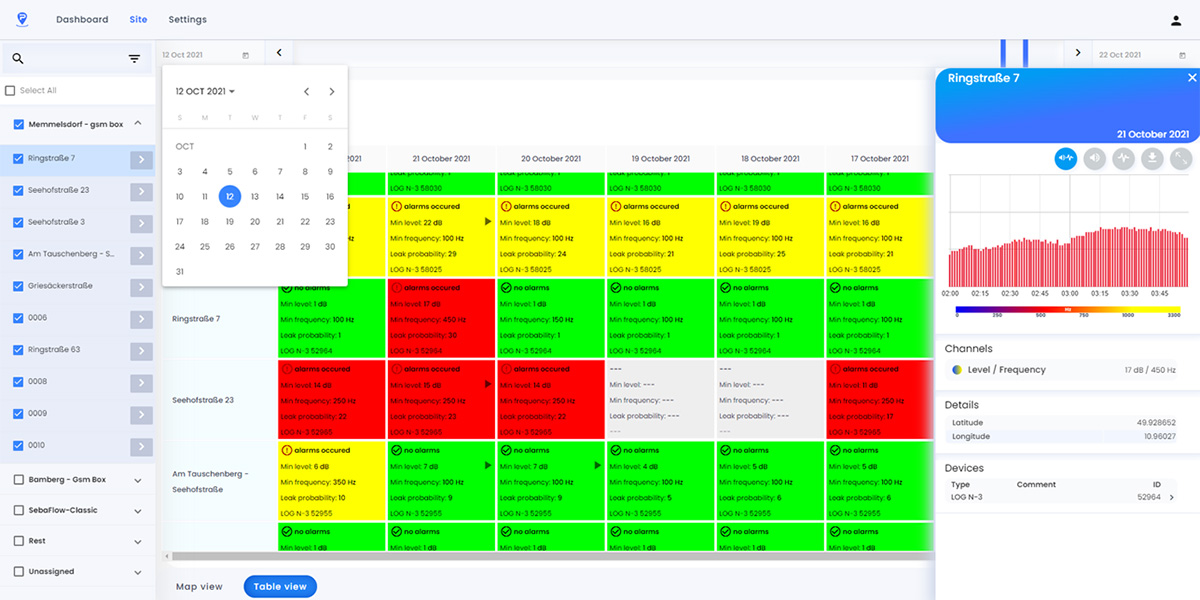
You want to check historical measurement data of a measuring point? Use the date slider directly above the map or optionally the calendar function.
By the way, these functions are also available when you switch from the map view to the table view.
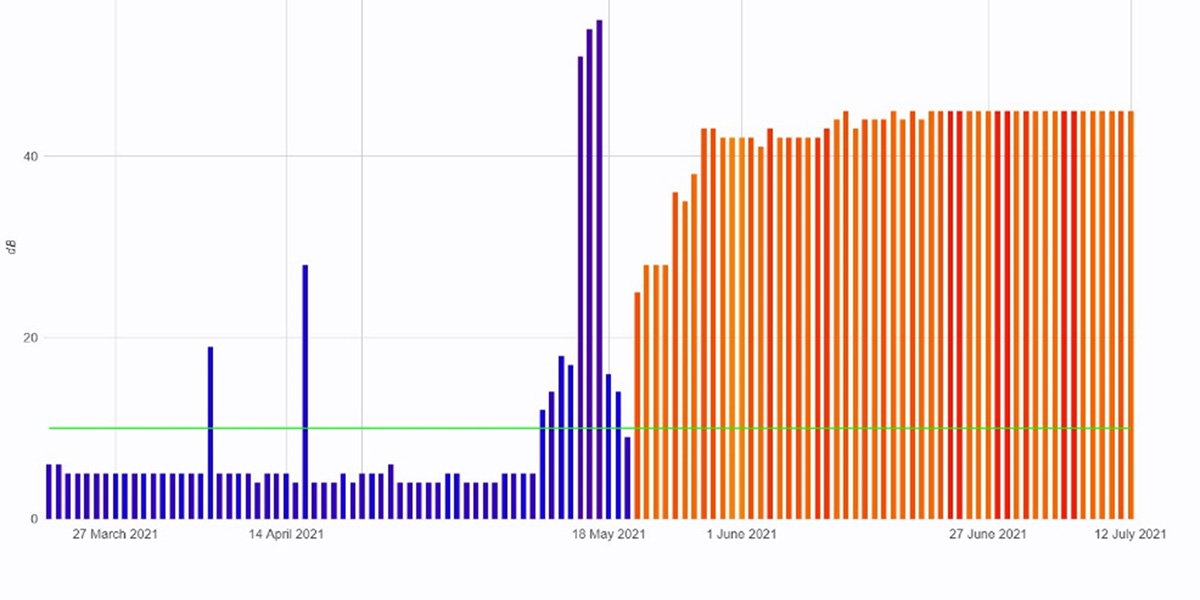
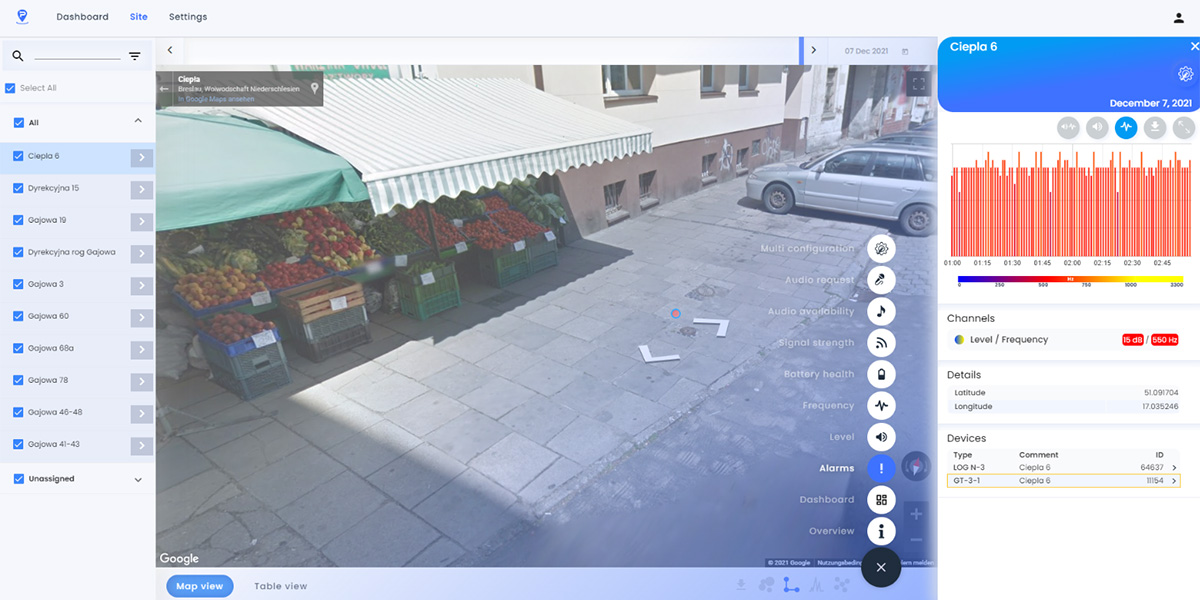
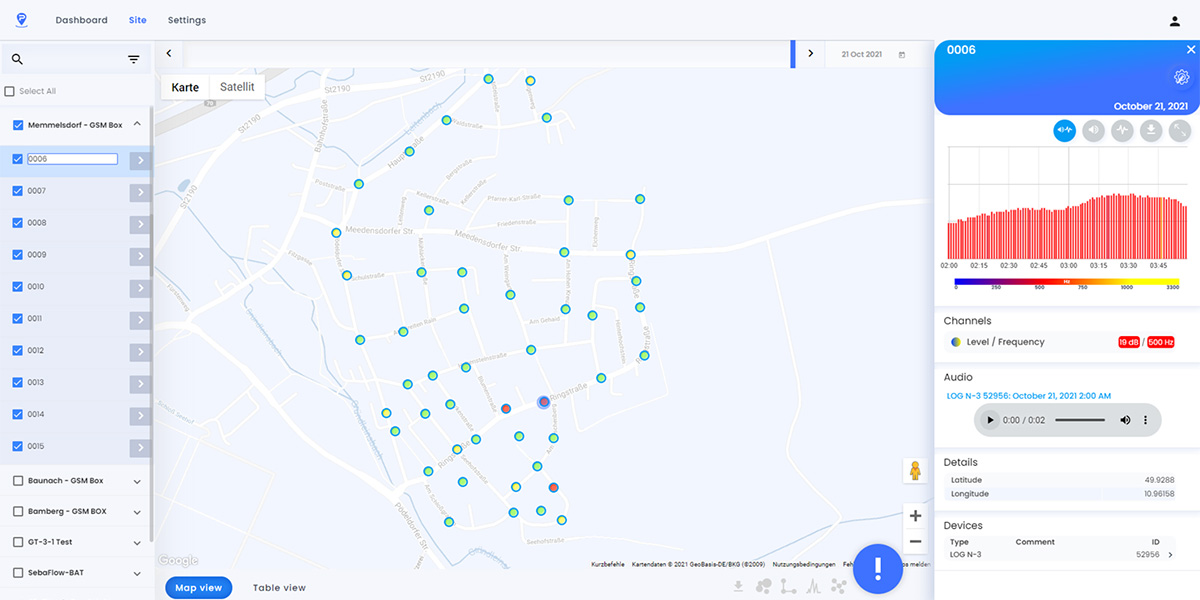
Here you can see typical events graphically represented in the detailed view.
This image shows the the process of a leak and its rising values (frequency as well as db).
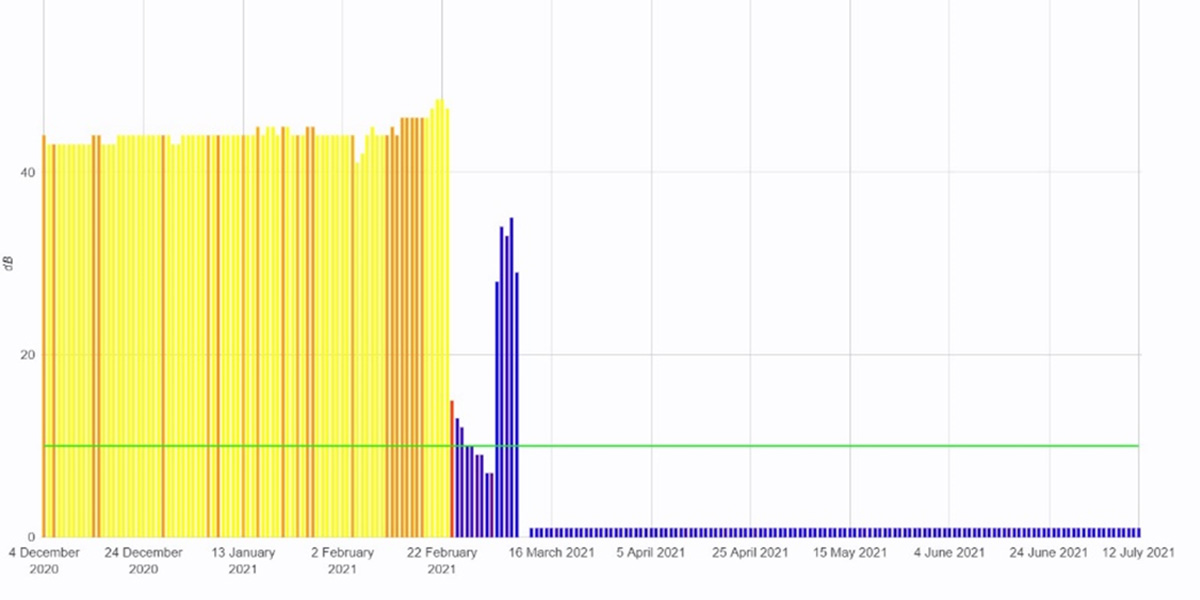
On this picture in the detailed view you can see the change of the measured values during the repair time.
After successful repair of the leak, you can see a very low combination of frequency and noise - as it should be!
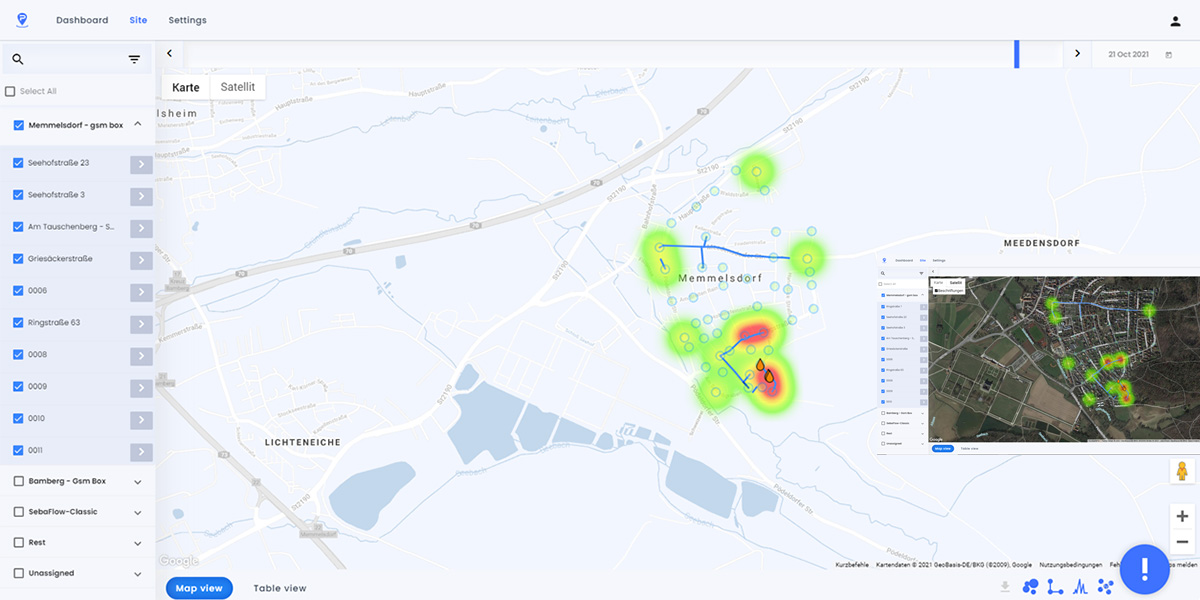
Whether maps or satellite view – the map functions can be used to the same extent.
Filter your dashboard according to your needs and export exactly what you see!
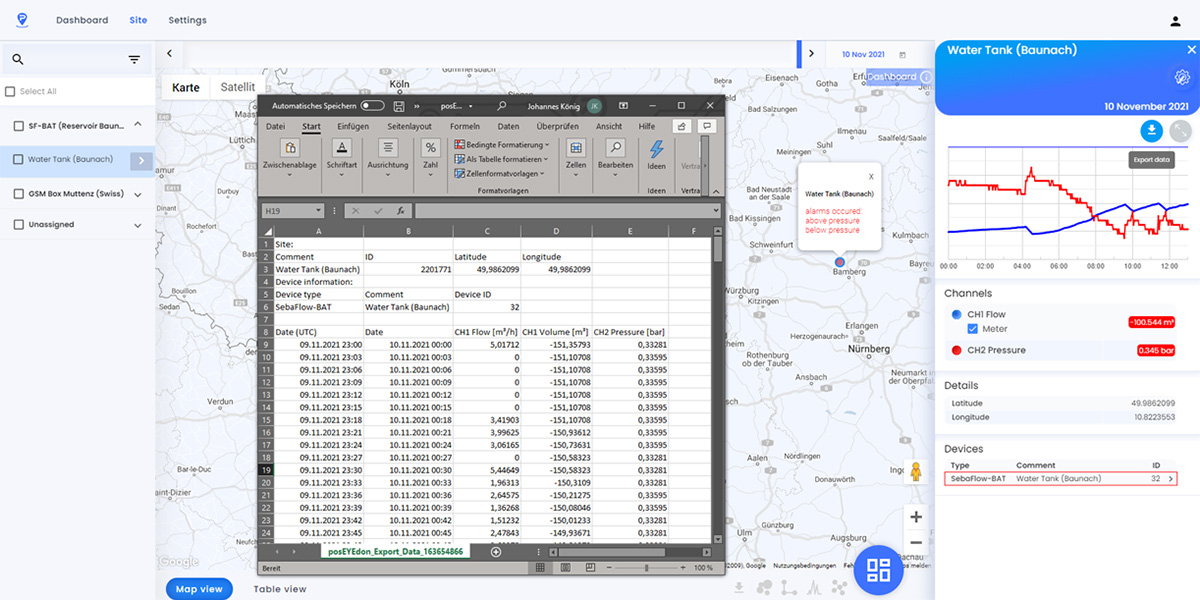
Here a water tank is monitored in parallel for flow and pressure (with our autonomously supplied SebaFlow-BAT system).
You can export the measurement, device or alarm data from the detailed view of this measuring point quickly and directly to CSV by clicking on the export button below the blue header.